Kubernetes: Setup grafana/loki-stack on a cluster for monitoring
Kubernetes: Setup grafana/loki-stack on a cluster for monitoring
Wednesday, January 1, 2025
Introduction
A simple guide on getting installing the grafana/lock-stack on Kubernetes.
Installing Prerequisites
Helm is needed. Below I chose to install it to my local ~/bin directory as that is my ${PATH}:
$ curl -fsSL --output /tmp/get-helm-3 "https://raw.githubusercontent.com/helm/helm/main/scripts/get-helm-3"
$ chmod +x /tmp/get-helm-3
$ mkdir -pv ~/bin
$ HELM_INSTALL_DIR=~/bin /tmp/get-helm-3 --no-sudo
$ rm /tmp/get-helm-3
Add the Grafana repository to Helm
$ helm repo add grafana https://grafana.github.io/helm-charts
“grafana” has been added to your repositories
$ helm repo update
Hang tight while we grab the latest from your chart repositories...
...Successfully got an update from the “grafana” chart repository
Update Complete. ⎈Happy Helming!⎈
Deploy it to the cluster
Note: I have deployed it to the monitoring namespace:
$ helm install --create-namespace --namespace monitoring loki grafana/loki-stack --set filebeat.enabled=true,logstash.enabled=true,promtail.enabled=true --set fluent-bit.enabled=true,promtail.enabled=true --set grafana.enabled=true
NAME: loki
LAST DEPLOYED: Sat Feb 11 03:32:15 2023
NAMESPACE: monitoring
STATUS: deployed
REVISION: 1
NOTES:
The Loki stack has been deployed to your cluster. Loki can now be added as a datasource in Grafana.

See http://docs.grafana.org/features/datasources/loki/ for more detail.
Test
PASSWORD=$(kubectl get secret --namespace monitoring loki-grafana -o jsonpath="{.data.admin-password}" | base64 --decode ; echo); echo "${PASSWORD}". This command should give you the password required in step 3.kubectl port-forward --namespace monitoring service/loki-grafana 3000:80.- Open http://localhost:3000. The username is
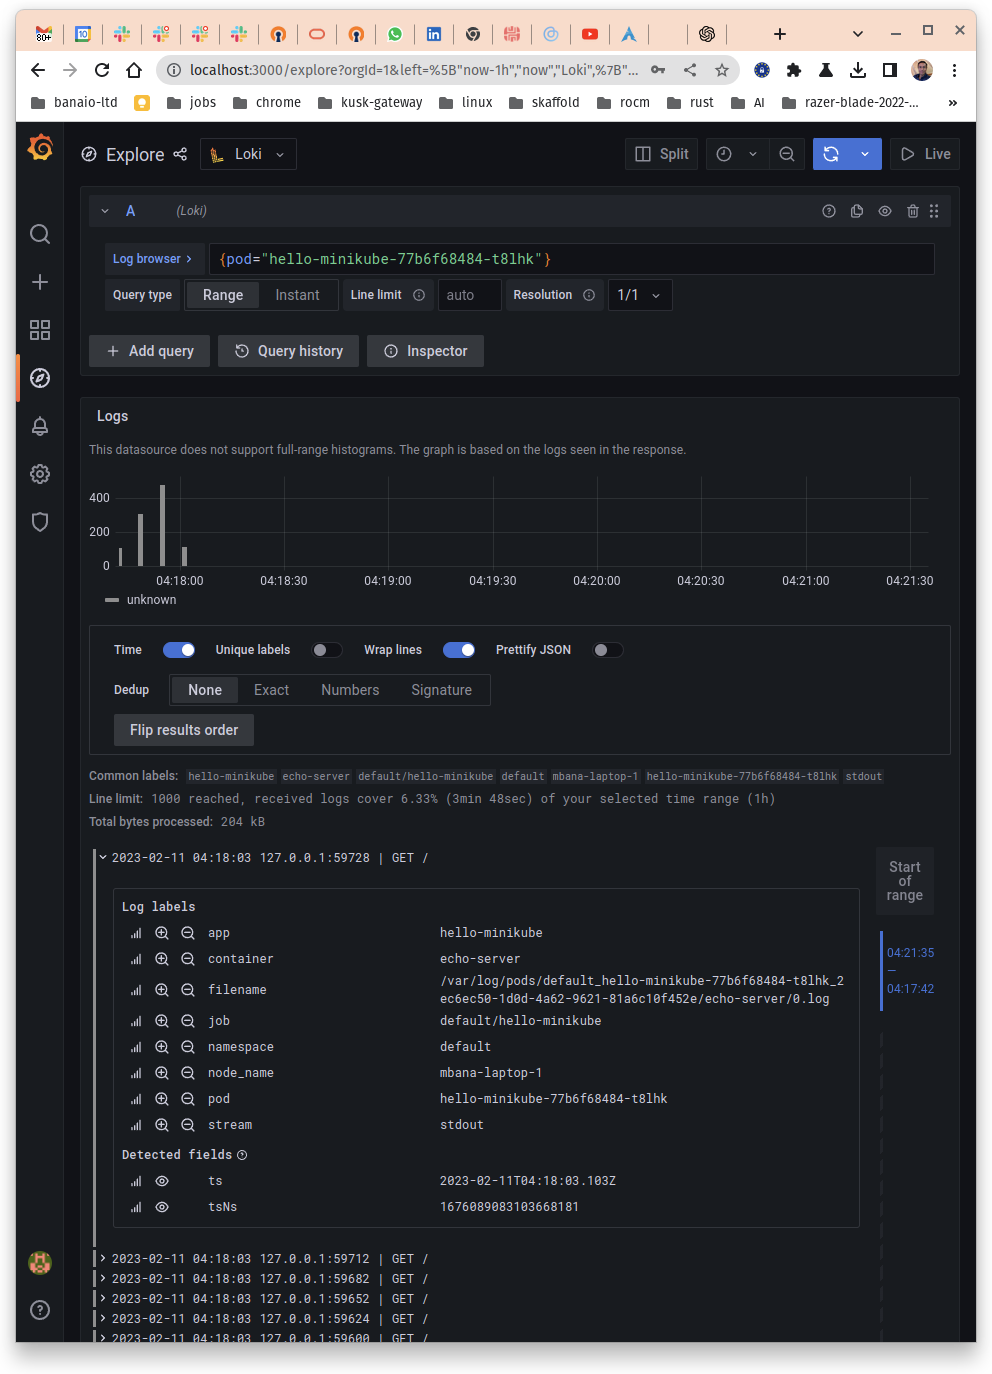
adminand the password is output of running step 1, e.g.,ZGrxcAMPmDN3DpEsAxER7jiraTIVQcyBSGilWqM4. kubectl create deployment hello-minikube --image=kicbase/echo-server:1.0: Create a deployment.kubectl port-forward --namespace default pods/hello-minikube-77b6f68484-t8lhk 8080:8080: Port forward to it so we can issue some requests.curl localhost:8080/: Make several of these calls, having said that one should be enough.- Look at Grafana and you should see something like below:
Last updated on • Mohamed Bana